
Financial Ratio Analysis for UK Small Businesses
Action Accountants •25 July 2026
You've got the accounts in front of you. The profit looks decent, the director's report sounds reassuring, and yet the bank balance keeps refusing to behave. That's the moment when financial ratio analysis stops being an abstract accounting term and starts becoming the quickest way to tell whether the business is strong, or just wearing a decent year-end face.
For UK small businesses, ratios work best when they're treated as trend signals, not trophies. A single year can mislead, especially when customers pay late, suppliers want cash faster, and VAT or payroll deadlines arrive right when the numbers on paper look calm. Used properly, ratios turn statutory accounts into a practical conversation about cash, debt, margins, and the shape of the business over time.
Table of Contents
- When the Numbers Look Fine but Cash Feels Tight
- The Five Families of Financial Ratios Every Owner Should Know
- Formulas and a Worked Example for a London Design Agency
- Reading Ratios Through a UK Sector Lens
- Common Pitfalls That Distort the Picture
- A Simple Spreadsheet Template You Can Build Today
- Putting Ratios Into a Quarterly Rhythm
- Frequently Asked Questions for UK Founders
When the Numbers Look Fine but Cash Feels Tight
A London design agency can post accounts that look tidy, with a respectable margin and no obvious disaster on the face of it. The founder still opens the banking app, sees a thin balance, and realises the next VAT payment is going to need careful timing. That gap between paper profit and actual cash is where many owners first meet financial ratio analysis in real life.
The point isn't that the accounts are wrong. It's that a profit-and-loss statement tells you what happened over a period, while the bank account tells you what can be paid today. If customers are slow, if a big invoice landed at month-end, or if a subcontractor chain is stretching payments, the business can look comfortable on paper and still feel tight in practice.
That's why the best owners use ratios as a bridge between statutory accounts and day-to-day decisions. They check whether liquidity is holding up, whether debt is creeping up, and whether margins are turning into usable cash. If invoice chasing is part of the problem, tools that help how to automate invoice processing can reduce manual drag and make the numbers easier to read from month to month.
Practical rule: if the accounts say one thing and the bank balance says another, trust the mismatch. That's usually the place to dig.
For many founders, the first useful question is not “What's my ratio?” It's “Which part of the business is making cash arrive too late?” That's where a proper review of cash flow improvement tactics becomes useful, because ratios work best when they're tied to actual collection, payment, and funding behaviour.
The Five Families of Financial Ratios Every Owner Should Know
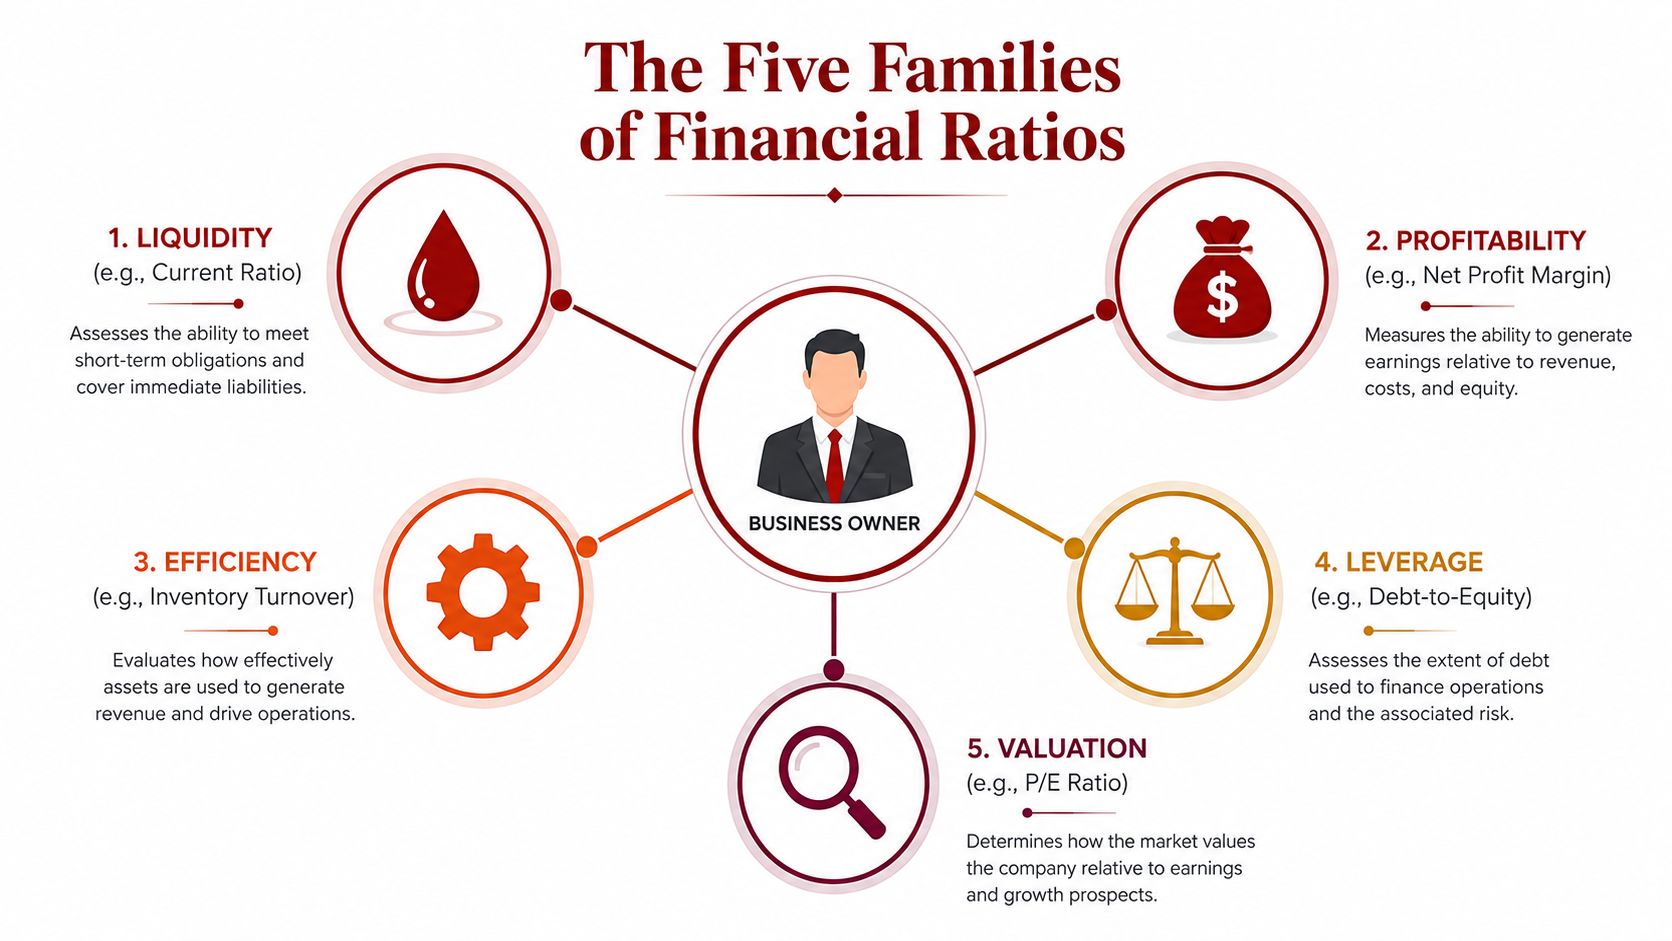
A good way to stop ratios feeling random is to sort them into five families. Once you know which family a question belongs to, the numbers become easier to read, because you're asking the right kind of question instead of comparing everything to everything else.
Liquidity is about paying soon
Liquidity asks whether the business can cover near-term bills. It represents the business's emergency fund. If current assets are low relative to current liabilities, the firm may still be profitable but struggle to settle invoices, VAT, wages, or loan instalments on time.
A simple working example is this, “Can I pay next month's bills without selling something awkward or borrowing again?” That is a liquidity question.
Profitability is about what is left
Profitability shows how much is left after the work is done and the costs are paid. It's the difference between busy and worthwhile. A business can be turning over lots of work and still keep very little of it if pricing, overheads, or labour costs are out of line.
If a founder asks, "After wages, rent, software, and delivery costs, what do we keep?", they're asking a profitability question.
Efficiency is about how hard each pound works
Efficiency ratios show whether assets and working capital are being used properly. Think of them as a labour-saving question, but for money. A firm with weak efficiency can have plenty of revenue and still have too much cash tied up in debtors, stock, or underused assets.
A practical test is simple. If the same revenue could be produced with fewer assets or less cash tied up, efficiency is probably the issue.
Leverage is about borrowed money versus own money
Debt-to-Equity looks at the balance between debt and equity. It matters because borrowing can help growth, but it also adds pressure when trading gets rough. Owners often feel this pressure most when interest costs rise or lenders start asking sharper questions.
If the core question is, “How much of this business depends on borrowing to keep moving?”, you're in debt analysis territory.
Valuation is the outsider's view
Valuation ratios matter most when someone outside the business is judging what it's worth. That could be an investor, a buyer, or sometimes a lender looking at risk and return. For many small businesses, valuation is less about a daily management tool and more about how the business looks from the outside.
A quick mental shortcut helps here. If the ratio is about survival, it's liquidity. If it's about returns, it's profitability. If it's about use of resources, it's efficiency. If it's about funding structure, it's capital structure. If it's about what the business might be worth, it's valuation.
Formulas and a Worked Example for a London Design Agency
A ratio only becomes useful once you can see where the numbers come from. The easiest way to learn the mechanics is to follow one simple example all the way through, so the formulas stop looking like separate rules and start feeling like different views of the same set of accounts. For this worked example, a fictional London design agency has current assets of £120,000, current liabilities of £80,000, inventory of £10,000, revenue of £300,000, gross profit of £180,000, net profit of £30,000, total assets of £200,000, debt of £70,000, equity of £130,000, and interest of £10,000. That gives us a coherent base to test the main ratios together.
| Ratio | Formula | Sample Input | Result |
|---|---|---|---|
| Current ratio | Current assets ÷ current liabilities | £120,000 ÷ £80,000 | 1.5 |
| Quick ratio | (Current assets - inventory) ÷ current liabilities | (£120,000 - £10,000) ÷ £80,000 | 1.375 |
| Gross margin | Gross profit ÷ revenue | £180,000 ÷ £300,000 | 60% |
| Net profit margin | Net profit ÷ revenue | £30,000 ÷ £300,000 | 10% |
| Return on assets | Net profit ÷ total assets | £30,000 ÷ £200,000 | 15% |
| Asset turnover | Revenue ÷ total assets | £300,000 ÷ £200,000 | 1.5 |
| Debt-to-equity | Debt ÷ equity | £70,000 ÷ £130,000 | 0.54 |
| Interest cover | EBIT ÷ interest | £40,000 ÷ £10,000 | 4.0 |
| Days sales outstanding | Debtors ÷ revenue × 365 | £25,000 ÷ £300,000 × 365 | 30.4 days |
The formulas are plain enough once you read them slowly. Current ratio tells you how many pounds of current assets sit behind each pound of current liabilities. Quick ratio is stricter, because it strips out inventory first. Gross margin shows what is left after direct delivery costs, while net margin shows what remains after overheads, finance costs, and tax. That difference matters because a business can look healthy at the gross level and still leak profit higher up the statement.
A ratio table like this is a snapshot. The better habit is to treat each ratio as part of a short time series, then compare the same measure across three to five years before you draw a conclusion. A single year can flatter a business after a good project finish or hide strain after a rough trading period. Trend is what turns the number into a signal.
Practical rule: do not stop at the first ratio that looks good. A strong gross margin can hide overhead pressure, and a comfortable current ratio can hide slow-paying customers.
The last two ratios in the table matter to lenders and owners for different reasons. Debt-to-equity shows how much the business leans on borrowing, and interest cover shows whether earnings can support that borrowing. A founder reading these together gets a much better sense of risk than from any one number alone. If you want the accounts behind the figures explained in plain English, browse the practical guide to small business accounting alongside your own year-end numbers.
For a fuller grounding in the accounts behind these calculations, it helps to browse the Practical UK guide on reading balance sheets alongside your own year-end figures.
Reading Ratios Through a UK Sector Lens
A ratio on its own can send you in the wrong direction. UK firms do not all carry the same balance-sheet shape, so the same headline number can mean very different things depending on whether the business holds property, waits on retention payments, or funds growth with little fixed asset base. That is why interpretation matters as much as calculation.
A useful way to read ratios is to ask what sort of business is sitting behind them. A number that looks ordinary in one sector can be tight, or even risky, in another. The comparison only starts to make sense once you place it beside the business model.
Construction contractors need a cash lens
Construction firms often deal with delayed invoices, retentions, and uneven project timing, so a strong-looking year-end ratio can still hide a weak 30-day cash position. The UK government's 2024 late-payment data reported that 35% of UK SMEs were owed late invoices in the year, and the Federation of Small Businesses found cash flow was a major concern for 67% of small firms in its 2024 survey, both of which make timing especially important when you are reading liquidity ratios. The same current ratio can look acceptable in a stable sector and uncomfortable in a contractor's balance sheet if the cash is already spoken for.
For contractors, the picture often changes from month to month because money is tied up in work-in-progress, materials, and customer payment cycles. That is why a single period-end figure can flatter the business. A short series of results shows whether the ratio is improving because cash is arriving, or whether it only looks better on the reporting date.
Property SPVs often look different on purpose
A small property company can carry a balance sheet that looks unusual to someone used to trading businesses. A property SPV may hold assets for the long term, so its ratios should be judged against that model rather than a generic trading benchmark. In practical terms, a ratio that looks modest on paper may still be perfectly normal if the SPV is funded and structured around asset holding rather than fast turnover.
The accounting framework can also affect the picture. FRS 102 changes and how they affect small business accounts can change how some balances are reported, so year-on-year comparison should always allow for the rules behind the numbers as well as the numbers themselves.
Early-stage startups need stage-aware interpretation
Early-stage founders often chase growth before efficiency settles. That means their ratios can look messy for reasons tied to investment phase, hiring, or product development rather than distress. A startup comparing itself to a mature trading business can misread normal growth-stage behaviour as weakness, so stage and funding history matter as much as the ratio itself.
The wider UK risk backdrop is another reason to be careful with universal thresholds. The Insolvency Service reported 25,159 company insolvencies in England and Wales in 2024, and construction was one of the most affected sectors, so sector-normalised reading is a safer question to ask than, “Is this ratio good in the abstract?” Ask instead, “Is this ratio good for my sector, my stage, and the way my business operates?”
If you want to compare the ratios in your own accounts with the statements behind them, it helps to browse the practical guide to small business accounting alongside your year-end numbers, then read the balance sheet with the business model in mind.
Common Pitfalls That Distort the Picture
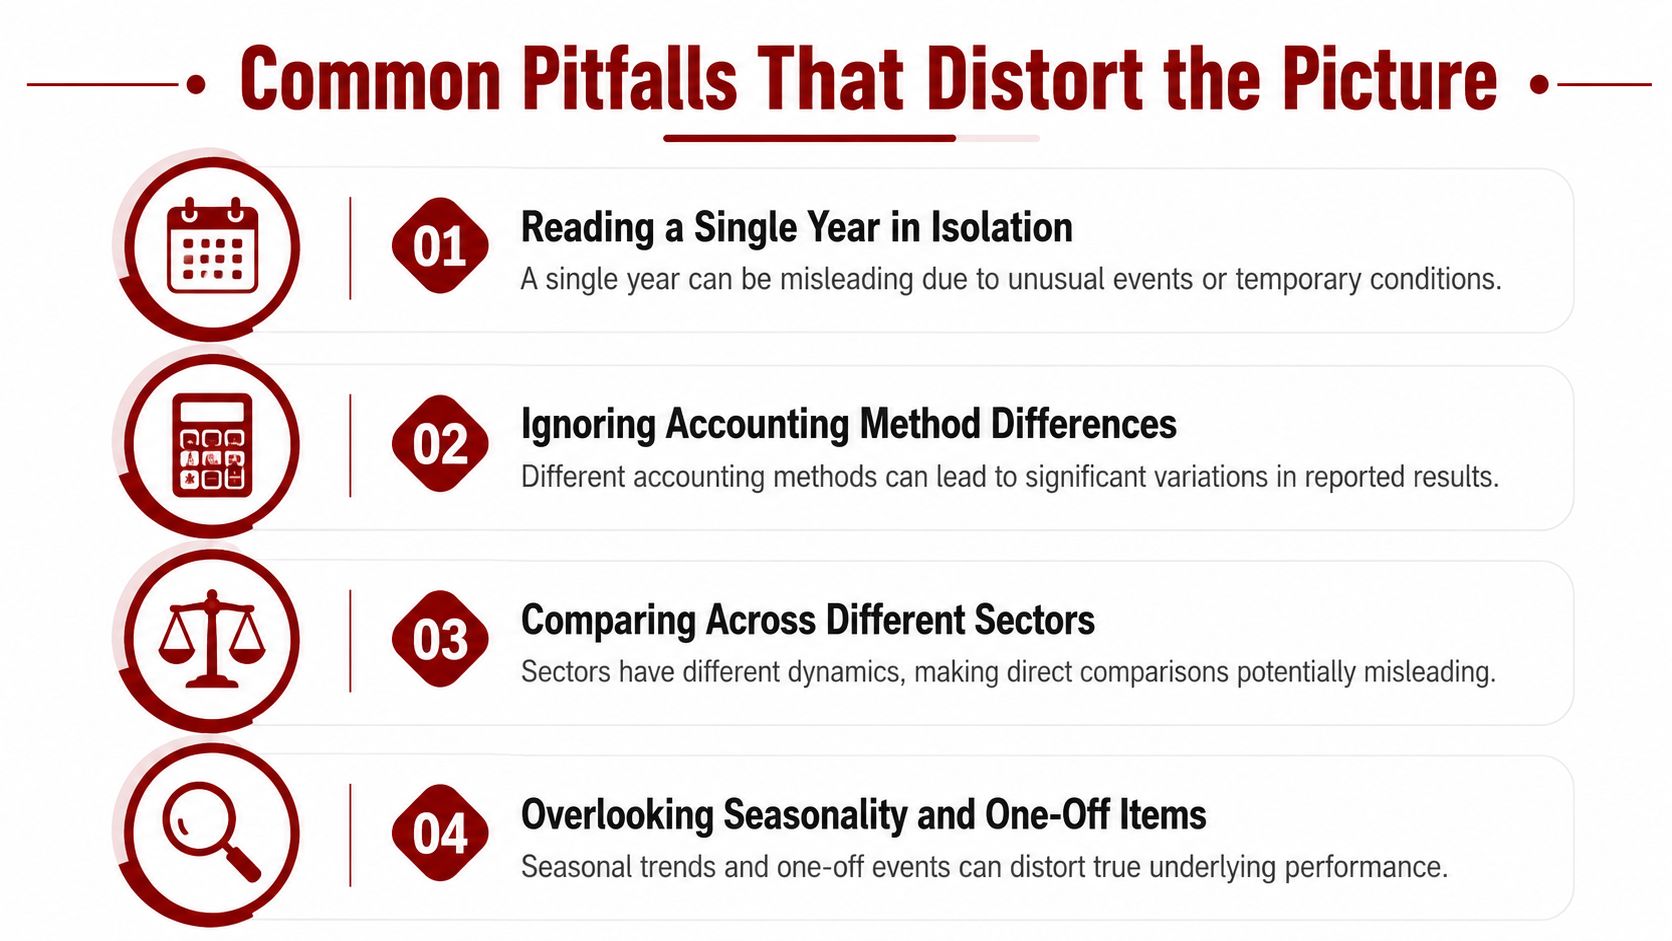
Most ratio mistakes are not arithmetic mistakes. They're interpretation mistakes. Owners see one number, attach a story to it, and miss the accounting or business reality sitting behind it.
Reading one year like it tells the whole story
A ratio only becomes meaningful when it's compared across time. That's why UK business accounts are most useful when you line up at least a few years and ask what changed. A single year can be distorted by a late contract, a temporary slowdown, a refinancing, or a one-off stock build.
Confusing gross margin with true profit
Gross margin can look healthy while profit after overheads is weak. That often happens when labour, software, office costs, or management time haven't been absorbed properly. The result is a business that looks efficient on the surface but leaves the owner wondering why there's so little left to draw.
Ignoring seasonality and working-capital swings
Seasonality changes the meaning of liquidity ratios. Construction firms are especially exposed to this because project timing, retentions, and invoicing milestones can make one date in the year look better than the rest. A strong year-end current ratio can still hide tight cash in the middle of the quarter.
Comparing against the wrong peer group
A SaaS startup should not compare asset turnover to a manufacturing business, and a property SPV should not expect the same liquidity profile as a busy subcontractor. Ratios only help when the comparison set makes sense. If the peer group is wrong, the conclusion will be wrong too.
Quick self-audit: ask whether the ratio has been reviewed over time, whether seasonality affects it, whether the business model changes the benchmark, and whether any unusual item is driving the result.
That four-point check is often enough to expose why a number felt “off” even before you start digging into the ledger.
A Simple Spreadsheet Template You Can Build Today
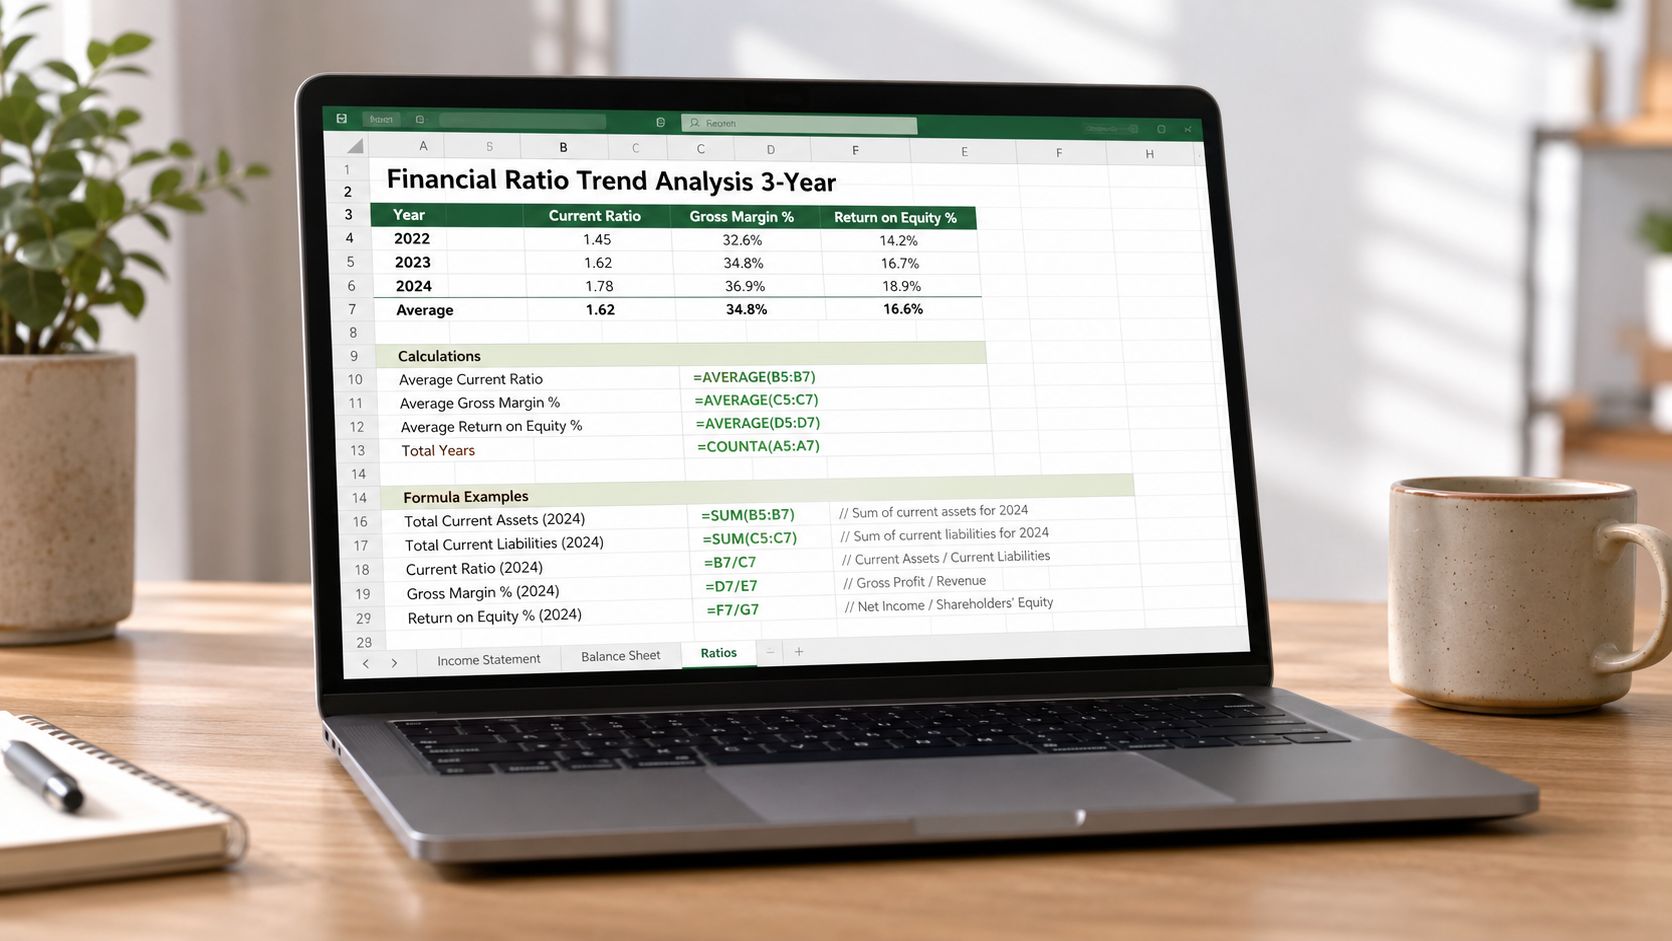
A spreadsheet beats a notebook because it keeps the same figures in the same place every time. That makes it much easier to spot whether a ratio is drifting, holding steady, or only looked odd because of one unusual month. The aim is not a flashy model. It is one file you can update quickly after each accounts cycle, then compare across three to five years.
Start with four tabs. Use one tab for raw accounts data, one for ratio calculations, one for three to five years of trend history, and one for a dashboard that shows what changed. Keep the input lines in the same order each year, current assets, current liabilities, revenue, gross profit, net profit, debt, equity, interest, debtors, and, for contractors, retention debtors.
The formulas can stay simple. Current ratio can sit in a cell as =CurrentAssets/CurrentLiabilities, gross margin as =GrossProfit/Revenue, and debt-to-equity as =Debt/Equity. Once those are in place, add conditional formatting on the dashboard so anything that moves sharply away from the business's own normal range stands out at a glance.
For a contractor, add a separate line for retention debtors. That makes the liquidity view more honest, because some of the money on paper is still tied up in work already done but not yet released. A contractor's ratio analysis becomes clearer when those balances sit in plain sight instead of being buried inside generic debtors.
Tidy input lines matter more than clever formulas. If the balance-sheet categories are messy, the ratios will only produce tidy-looking confusion, so it helps to browse the Practical UK guide while you set up the spreadsheet structure. For cash planning, keep cash flow forecasting guidance next to the ratio review, because ratios show what has happened and forecasts help you decide what to do next.
Putting Ratios Into a Quarterly Rhythm
Ratios work best when they become a habit instead of a rescue mission. A simple quarterly rhythm is enough for most founders. Refresh the inputs, review the trend sheet, and write one short note on what changed and why.
That note matters more than people expect. If margins improved because pricing changed, or liquidity weakened because a customer paid late, you want that recorded while it's still fresh. By the time the next VAT or payroll cycle arrives, memory is often too fuzzy to explain the movement properly.
A sensible rhythm also stops owners from overreacting to one messy month. If the ratios are watched regularly, you can see whether a wobble is temporary or part of a deeper pattern. That makes conversations with your accountant more useful, because you're discussing signals rather than panic.
If you want to make the review more practical, tie it to the same calendar dates every quarter, then compare the current period with the same point last year. That keeps seasonality in view and helps you avoid reading a quiet quarter as if it were a crisis.
For cash planning in particular, cash flow forecasting guidance belongs next to your ratio review, not somewhere separate. Ratios tell you what has happened, forecasts help you decide what to do next.
FAQ in brief. How often should ratios be reviewed? Quarterly is realistic for most owners, with a fuller annual review when the statutory accounts are final. Which ratios matter most for lenders? Liquidity, debt, and interest cover usually carry the most weight. Can software produce them? Yes, but a separate trend sheet helps you read them properly. What is the fastest warning sign of trouble? A liquidity ratio that weakens while debtor days and supplier pressure are both moving the wrong way.
Frequently Asked Questions for UK Founders
How often should I look at ratios? Quarterly is usually the sweet spot for a busy founder, because it's frequent enough to spot a problem and realistic enough to maintain. Annual review alone is too slow if customers are paying late or costs are moving.
Which ratios matter most if I'm applying for finance? Lenders usually care most about liquidity, gearing or debt-to-equity, and interest cover, because those numbers speak directly to repayment risk. If you're a contractor or property owner, the balance sheet context matters just as much as the headline figure.
Can I calculate them from Xero or QuickBooks? You can pull the raw figures from accounting software, but a simple spreadsheet still helps because it lets you track the same ratios over 3 to 5 years and compare them consistently. Software gives you the data, while the spreadsheet gives you the story.
What's the fastest cash warning sign? A current ratio or quick ratio that looks fine on paper while debtor balances are rising and payments to suppliers are stretching. That usually means the business has a timing problem, not just a profit problem.
Action Accountants Limited helps London founders, contractors, landlords, and growing SMEs turn accounts into decisions they can use. If you want clearer ratio analysis, better cash-flow visibility, and practical support from a team that understands UK small businesses, visit Action Accountants Limited and start a conversation about your numbers.